Reports
During the life cycle of an interaction, Lynn is storing data which can be exploited through the reporting module, offering the solution a view of the user behavior while interacting with the Lynn application flow.
The reporting module is based on a set of custom graphs configured by the Lynn application administrator, which has an interface in Lynn where you can select from a group of graphs and dashboards.
Lynn has two separate environments, similarly the stored information and the configured graphs are disaggregated in their respective environment, so it is important to remember that when a Lynn application is published for the first time, the Lynn application administrator must access the productive Lynn interface and activate the corresponding graphs, this is a job that is only done once, it would no longer be necessary to do in future publications unless a new graph is to be incorporated or one that no longer applies is to be eliminated.
Additionally, there is a set of APIs that allow the client to extract the information with which the graph was built. As a previous requirement, these graphs must be previously configured in the Lynn application.To check how to consume this API click HERE.
Accessing Your Dashboards
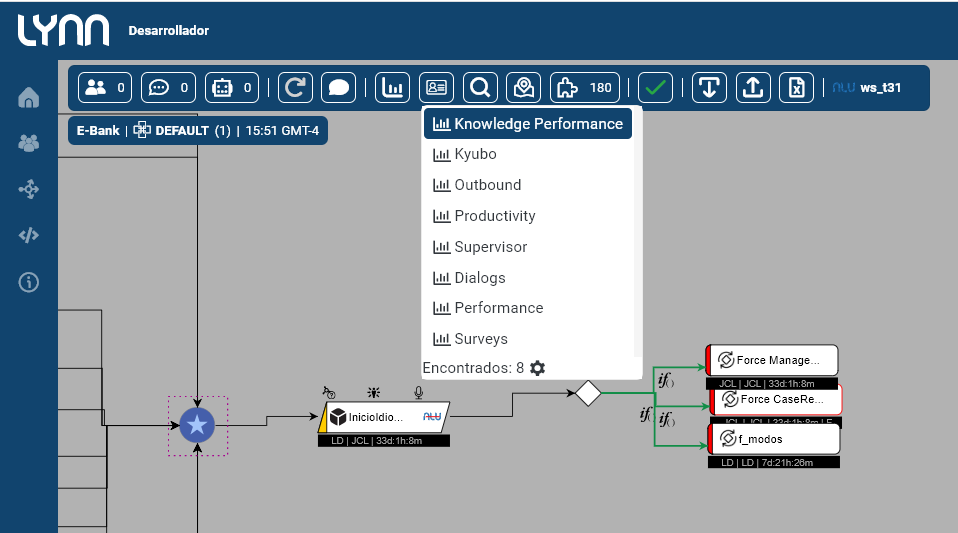
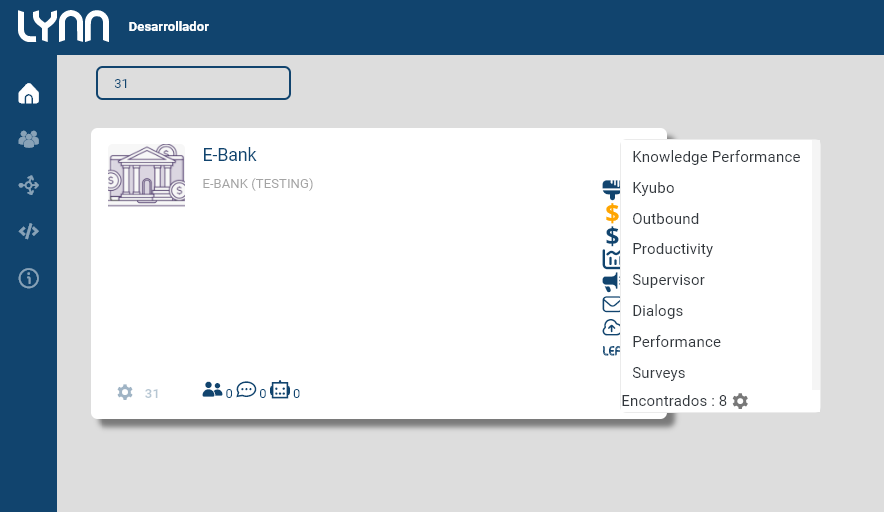
You can access your dashboards from the flow designer or by searching for the application on Lynn's home page.
Flow Designer:
Lynn Application:
Create a new dashboard
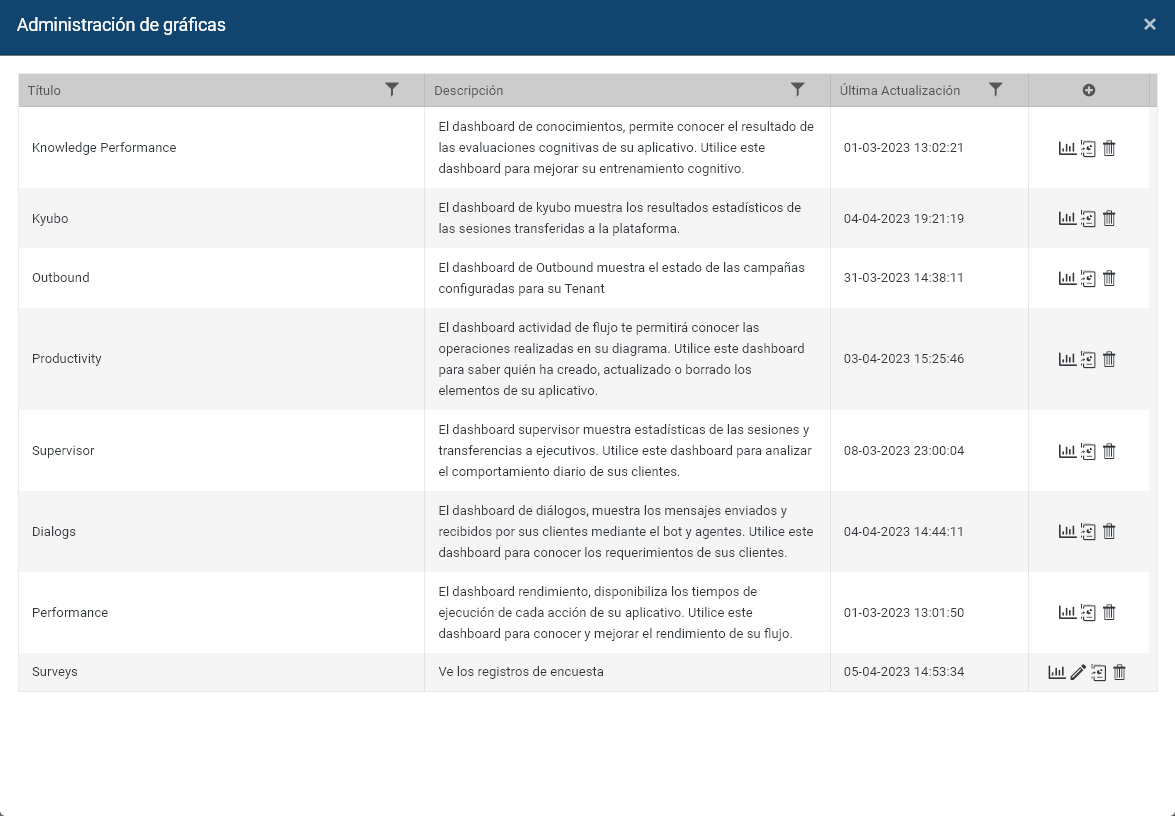
Within the flow designer, locate the "dashboard manager" icon. This will open the window displaying the currently configured charts. Find the "+" icon in the upper right corner, which will allow you to add default and custom dashboards to your application.
Default Reports
The default dashboards have been created by the Lynn team, each of which is designed to analyze a specific component within your application. To learn more about these reports, please refer to the Default Reports Offering.
Custom Reports
You can create your own dashboards with the visualizations you deem necessary. Customize your dashboard by combining the available charts for your tenant.
-
Locate the "+" icon, then give your custom dashboard a title and description.
-
Next, select the chart you want to include.
-
View the chart by selecting the icon.
Watch the following video to see these steps in action:
Important!: The delete option will permanently erase your dashboard and visualizations from both Lynn and Kibana. The data will not be lost.
Limitations in report usage
- Only 20 dashboards per application are allowed.
- Default dashboards cannot be edited.
- Automatic report delivery is limited to once per day.
- Only authorized individuals can view the dashboards.
Default Reports Offering
The following reports or dashboards are available:
- Dialogues
- Outbound
- Supervisor
- Productivity
- Knowledge Performance
- Performance
- Menu Detail
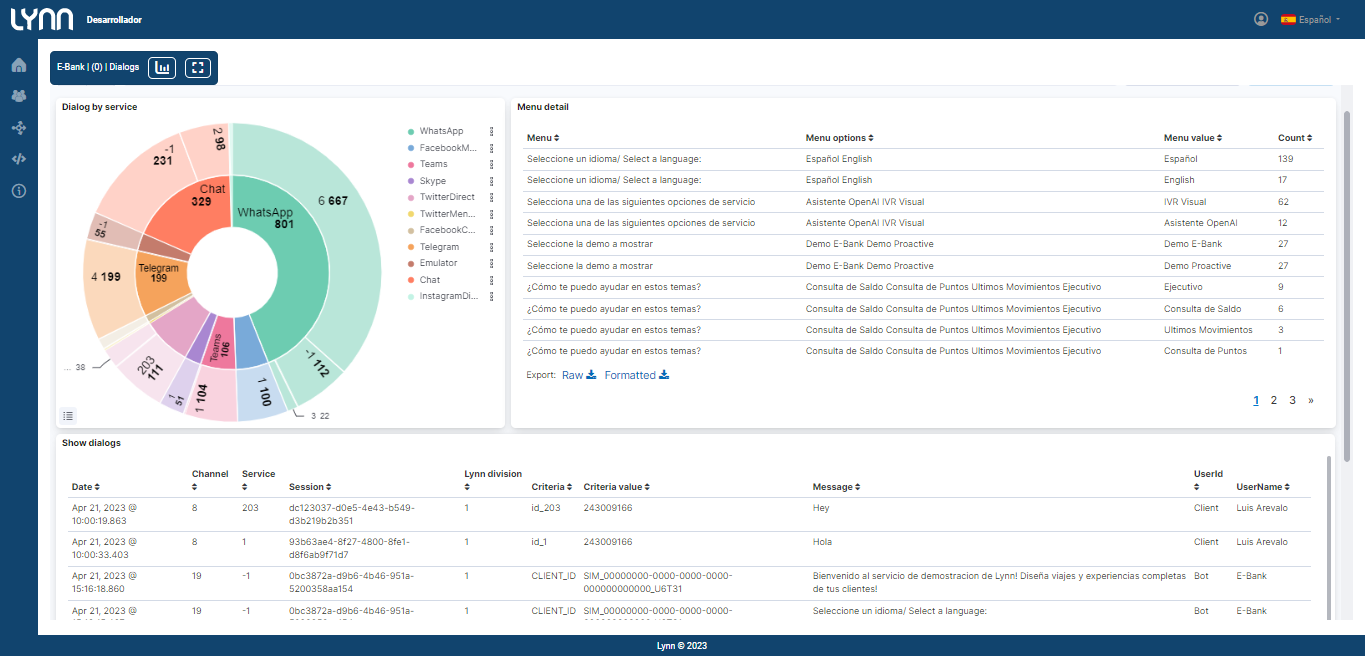
Dialogues Dashboard
This dashboard refers to chat-type interactions. It allows you to obtain details about chat interactions, menu options queried, etc.
Charts
-
Dialog by service: Pie chart that displays the total number of interactions according to the occupied channels, as well as the service(s).
-
Menu detail: Chart that allows you to know the total quantities of usage for each menu option.
| Field | Description |
|---|---|
| Menu | The name or initial message of the menu, for example: "Select one of the following options from the Sales Service menu." |
| Menu options | Menu options, for example: 1. I'm interested in the offer, 2. I'm not interested in the offer, 3. Transfer to an executive. |
| Menu value | Selected option, for example: 2. I'm not interested in the offer. |
| Count Number | of times this option was selected. |
⚠️Update note: This graph is only available for validation of historical data prior to 01/07/2023. After this date, the information provided by this graph is contained in the work desktop Menu Detail.
- Show dialogs:Table-type graph that provides the details of the dialogs. Below are descriptive details of each field.
| Field | Description |
|---|---|
| Date | Date and time of the dialog. |
| Channel | Channel associated with the interaction: WhatsApp=1, Facebook Messenger=2, Teams=3, Skype=4, SMS=5, Slack=6, DirectLine=7, TwitterDirect=8, TwitterMention=9, FacebookComments=10, Email=12, Klik=14, Line=15, Cortana=17, SkypeVoice=18, Emulator=19, Chat=20,InstagramComments=22, InstagramDirect=23, VoiceExternalProvider=25, VoiceInternalProvider=26. |
| Service | Differential number assigned by Lynn. |
| Session | Session identifier in Lynn. |
| Lynn division | Division associated with the interaction. |
| Criteria | Differential number assigned by Lynn. |
| Criteria value | Depends on the channel. WhatsApp number. |
| Message | Text of the dialog. |
| UserId | Describes the user who wrote the dialog: Bot, client, agent (advisor). |
| Username | Name associated with the user, this can be a parameter provided by the social network, an integration, or the outbound contact list. |
Outbound Dashboard
It is composed of a group of progression and table-type graphs that will help you visualize the progress of your campaign.
Dashboard controls (filters)
- Campaign name: List of campaigns by name.
- Campaign mode: List of campaign dialing modes.
- Load description: List of performed loads. The load name describes the date/time_user_number of loaded records.
Graphs
Campaign Records: The graph represents the cumulative sum over time of the campaign record states.
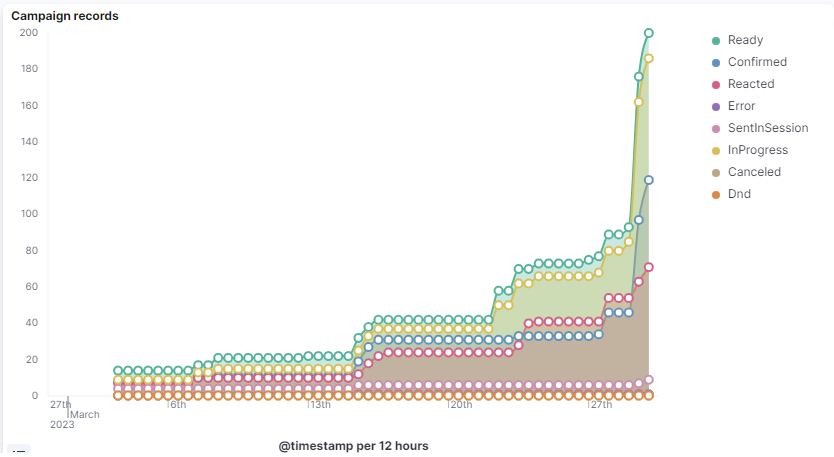
Here is the definition of each Record State:
| State | Description |
|---|---|
| Ready | The record will be processed when the campaign is executed. Validated and ready to be sent. |
| InProgress | Lynn has the record in progress to be sent. |
| Sent | It has been sent, and the receipt has been confirmed by the social network. |
| Confirmed | Confirmation of delivery or reading by the social network. |
| Reacted | State when the user reacts to the proactive message. |
| SentInSession | User reacted with an active session. Counted within reacted. |
| Error | An error occurred while processing the campaign record. |
| Cancel | When the campaign record is canceled from the self-service flow. |
| Dnd | When executing the record, the contact is on the Blacklist for the campaign. |
- Channels records: This graph presents the cumulative sum over time of the campaign records created for each channel.

- Campaign activity:Displays the mode and status of campaigns over time.

-- Campaign Status
- Awaiting: Campaign paused
- Dialing: Campaign in progress
-- Campaign Mode
| Status | Description |
|---|---|
| Manual | The campaign requires the action of an administrator to start and stop. |
| Scheduled | The campaign will start and stop automatically based on the configured start and end dates. During this period, the campaign will behave like AlwaysOn. |
| AlwaysOn | The campaign will always be in a started state. Created campaign records will be processed automatically. This execution mode supports scheduled records. |
- Current campaign status: Table detailing the last recorded status for each campaign. The table summarizes the mode, the recorded date for the last status, and the current status of the campaign.

- Detail OutBound: Campaign Log Table. Allows visualization of processed campaign logs and their status.
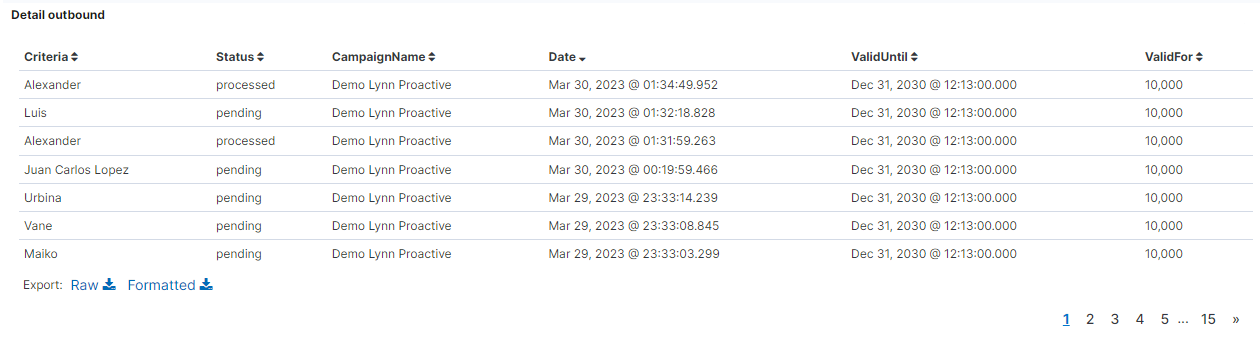
Below is the definition of each field:
| Field | *Description* |
|---|---|
| Criteria | Contact name |
| Status | Last status of the campaign log |
| CampaignName | Campaign name |
| Date | Date when the campaign log was processed |
| ValidUntil | Date until which the campaign log will be valid |
| ValidFor | Date until which the campaign log will be valid in seconds |
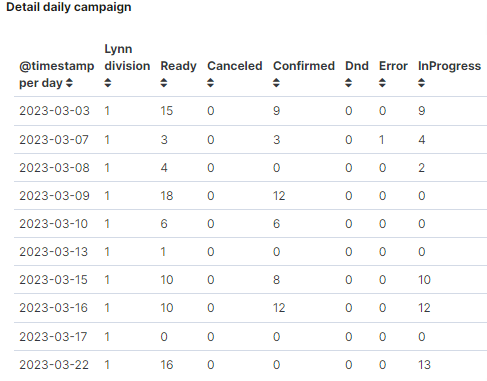
- Detail daily Campaign: Daily summary table with the total count of campaign log states that the records have passed through, including the |breakdown by Lynn.
- Records Overdue: Sum of scheduled records that are attempted to be executed after the scheduled date.

- Reacted in session: Sum of records that have been reacted with an active session.

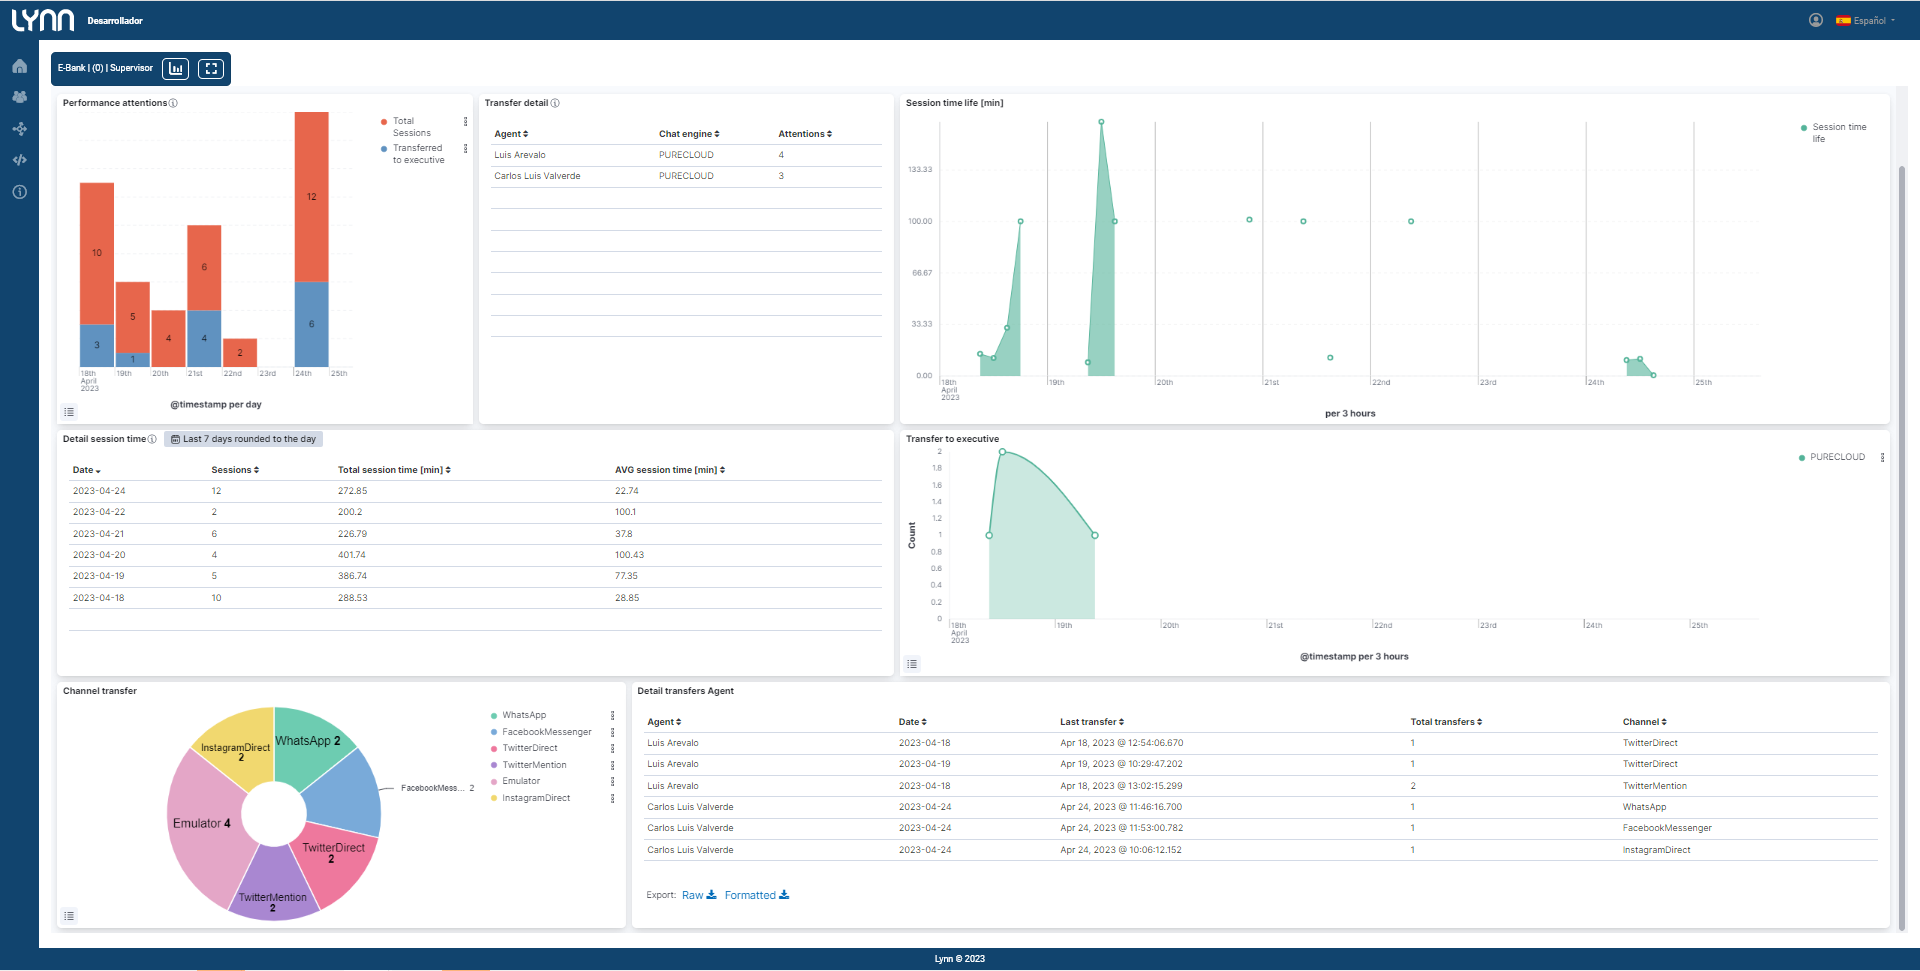
Supervisor Dashboard
The Supervisor Dashboard displays statistics of sessions and transfers to executives. Use this dashboard to analyze the daily behavior of your customers.
Dashboard Controls (Filters)
- Agent: List of agents who have had activity according to the applied time filter.
Charts
-
Performance attentions: Graph showing the total number of sessions created and sessions transferred to an agent. By default, the graph will display statistics for the past two days. The values will update immediately after a client creates a session or is transferred to an agent.
-
Detail transfer: Table showing the number of transfers Lynn has made to agents. By default, the table will display statistics for the queried day. The number of attentions does not consider whether the agent responds to the client or not, nor does it consider transfers once the call has been answered. The table is updated when Lynn performs the transfer.
-
Session time life: Time-based graph showing the average lifespan of sessions. If the client is transferred to an agent, the lifespan time will be included in the session. The graph is updated once the client's session has ended.
-
Detail session time life: Table showing session statistics per day. By default, the table will display results for the past 7 days. The "total session time" field represents the total sum of session times in minutes, and "AVG session time" represents the average of those times. The graph is updated once the client's session is completed.
-
Transfer to executive: Time-based graph showing the number of transfers made to agents. The graph is updated after Lynn performs the transfer.
-
Channel transfer: Graph that allows visualization of the total number of interactions transferred according to the originating channel.
-
Detail transfers agent: Table-type graph displaying the total number of transfers made per day. Here, you can see the agent's name, the date of the total transfer, details of the date and time of the last transfer made, total transfers, and the originating channel.
Dashboard Productivity
The Flow Activity dashboard allows you to track the operations performed in your diagram. Use this dashboard to find out who has created, updated, or deleted elements in your Tenant.
Dashboard Controls (Filters)
-
User: List of users assigned to your Tenant who have had activity according to the applied time filter.
-
Element: List of diagram elements that have had activity according to the applied time filter.
Charts
-
Top Flow Activity: Graph showing the activity that has taken place in your diagram. The count value represents the number of times a user from your Lynn application has performed an operation on the element.
-
Detail Lynn Activity: Table showing the detailed operations performed on your elements. You can also find the element ID and the name of the user who modified your elements.
-
Top Activity by User: Displays the top 10 users who have worked on your Lynn application. It is sorted from highest to lowest based on user activity.
-
Activity Schedule: Time-based graph showing the activity performed by users who have worked on the Lynn application. The graph is updated each time a new operation is recorded.
Dashboard Knowledge Performance
El dashboard de conocimientos, permite conocer el resultado de las evaluaciones cognitivas de su aplicativo. Ocupe este dashboard para mejorar su entrenamiento cognitivo.
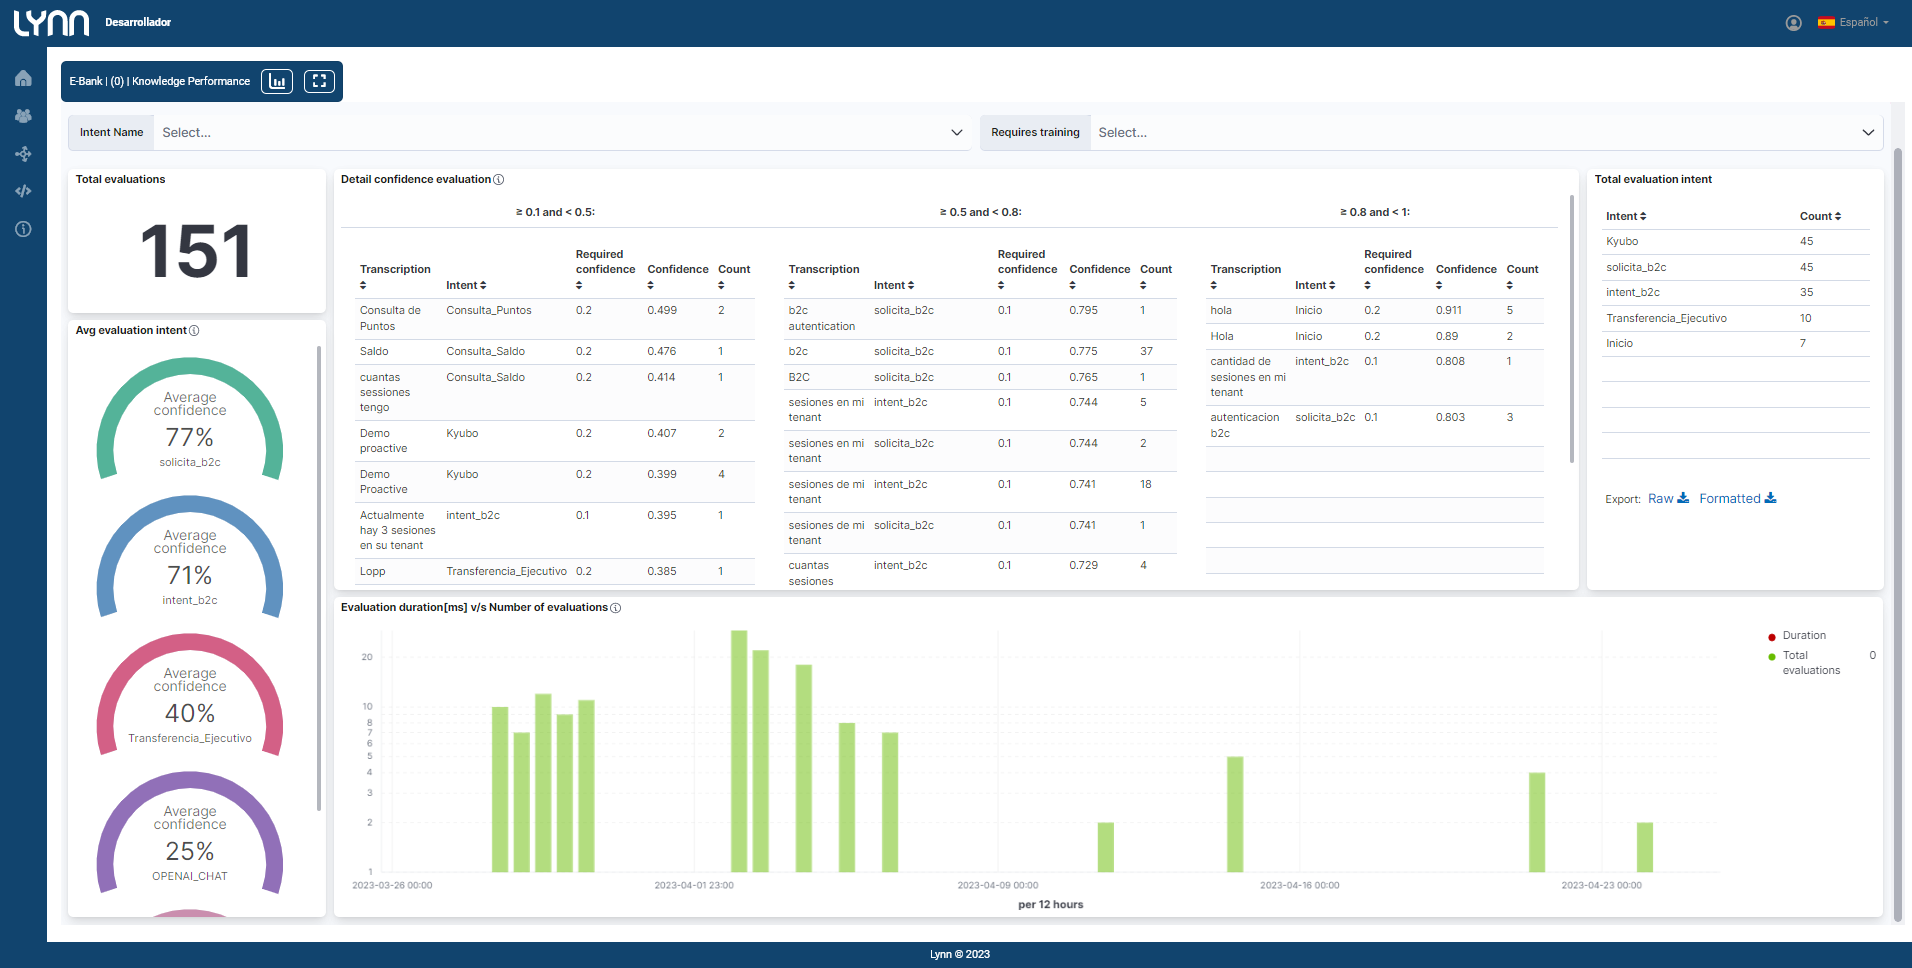
Dashboard Controls (Filters)
Intent Name: List of intents that allows you to select one or more for evaluation within the dashboard.
Requires training: Menu option for true or false. Select True to view training phrases that have not met the acceptance percentage configured in your Intent. You can see these highlighted training phrases within the Detail confidence evaluation table. Select False to view training phrases that have surpassed the acceptance percentage of your intent and have been able to execute actions correctly.
Charts
-
Total evaluations: Counter showing the total number of cognitive evaluations performed by the Lynn application.
-
Avg evaluation intent: The graph displays the average of the 5 intents with the worst cognitive evaluation.
-
Detail confidence evaluation: Tables with the results of the cognitive evaluations. The graph is divided into 5 dynamically generated tables (each exportable) according to predefined ranges:
-
Range 0 - 0.1: If the result of a cognitive evaluation is 0, it is likely that the user's input phrase is not trained in your cognitive engine.
-
Range 0.1 - 0.5: The training result is still low, and it is recommended to improve your training and verify the confidence percentage of your intent.
-
Range 0.5 - 0.8: An acceptable training result. If the intent is not executed, check the acceptance percentage configured for your intent.
-
Range 0.8 - 1.0: The evaluated phrase perfectly matches your training.
-
-
Evaluation duration[ms] v/s Number of evaluations: Time-based graph showing the average duration of cognitive evaluations and the number of evaluations performed. Use this graph to understand the timing of your cognitive evaluations. You can identify that the evaluation time is good when it remains consistent over time.
-
Total evaluation intent: Shows the total number of times a cognitive evaluation has resulted in the displayed intents in the table.
Dashboard Performance
The Performance dashboard provides the execution times of each action in your application. Use this dashboard to understand and improve the performance of your flow, such as response times of each extension module within the flow, behavior of APIs, and actions involving third parties, such as integrations with external bots.
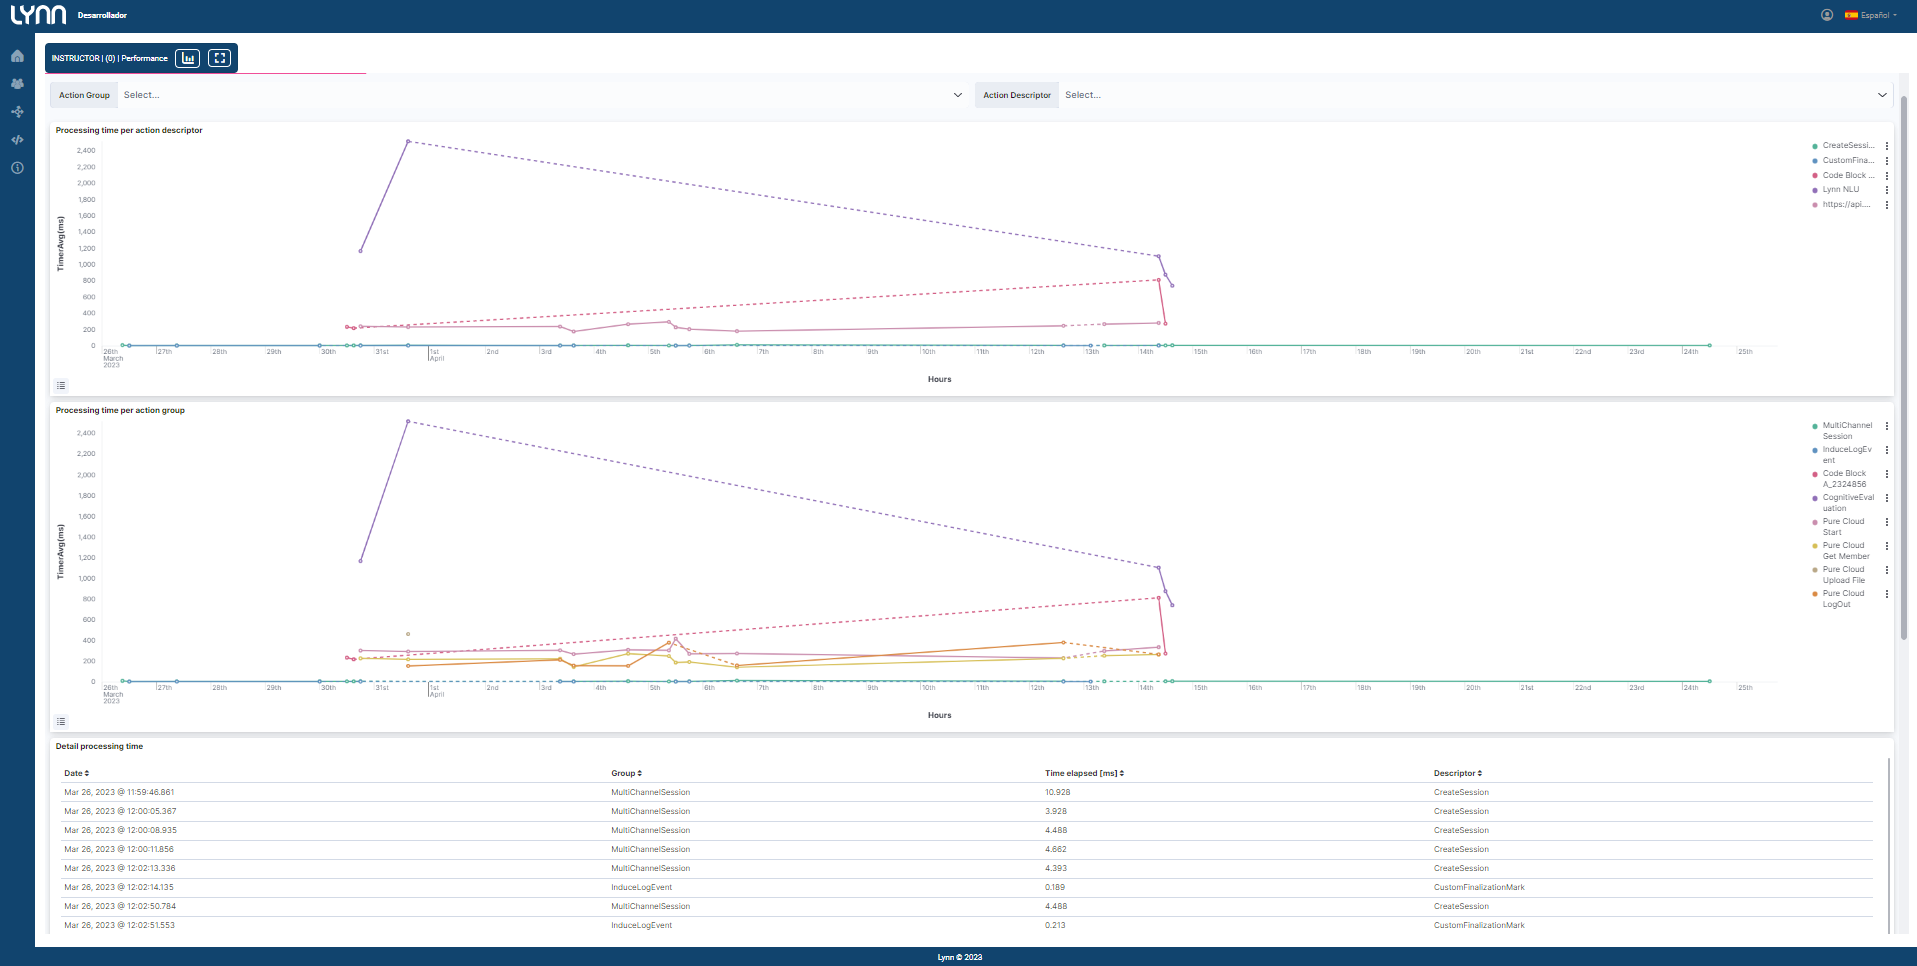
Dashboard Performance Controls (Filters)
- Action Group: List of action groups.
- Action Descriptor: List of actions.
Charts
-
Processing time per action descriptor [ms]: Heatmap that allows you to identify the average execution time of actions. The displayed times are measured in milliseconds, and the chart is updated every time an action is executed within your application.
-
Processing time per action group [ms]: Heatmap that allows you to identify the average execution time of action groups. The displayed times are measured in milliseconds, and the chart is updated every time an action is executed within your application.
-
Detail processing time: The table shows the details that allow you to identify the actions, action groups, date and time of execution, and the time it took to execute each action.
Dashboard Menu Detail
This dashboard consists of visualizations aimed at managing and inspecting responses from menus.
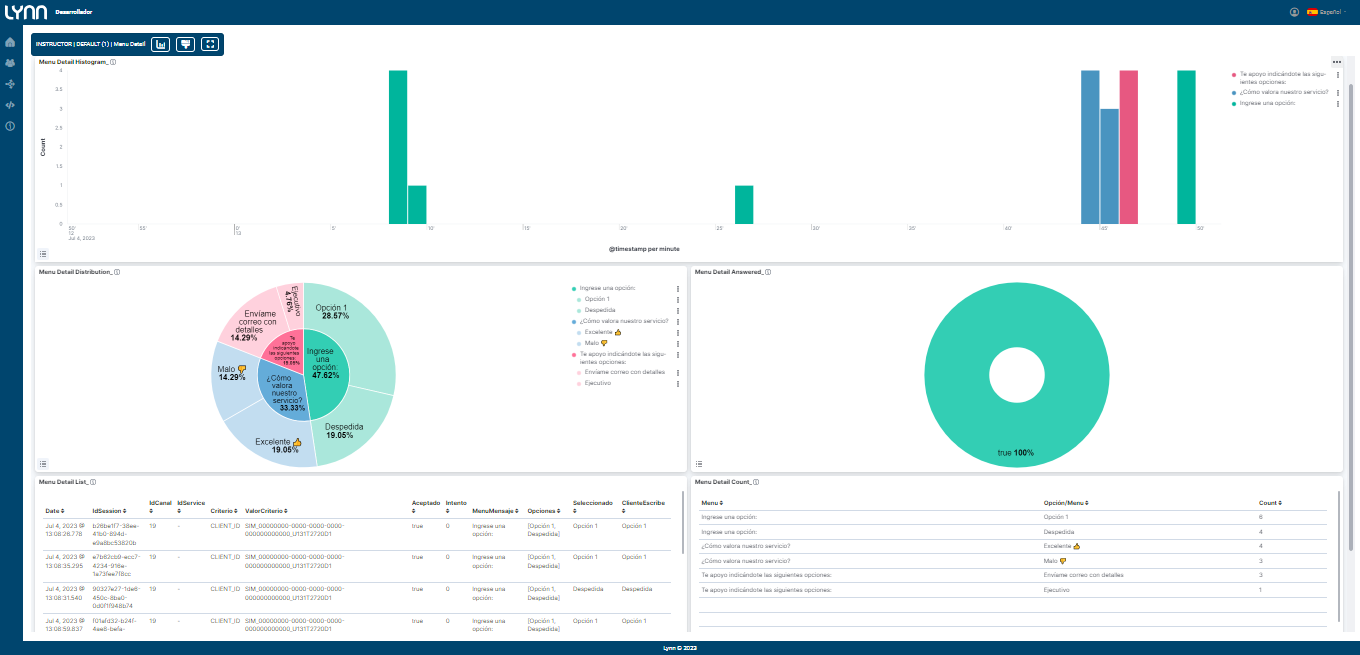
Dashboard Performance Controls (Filters)
This graph does not have additional controls other than the date.
Graphs
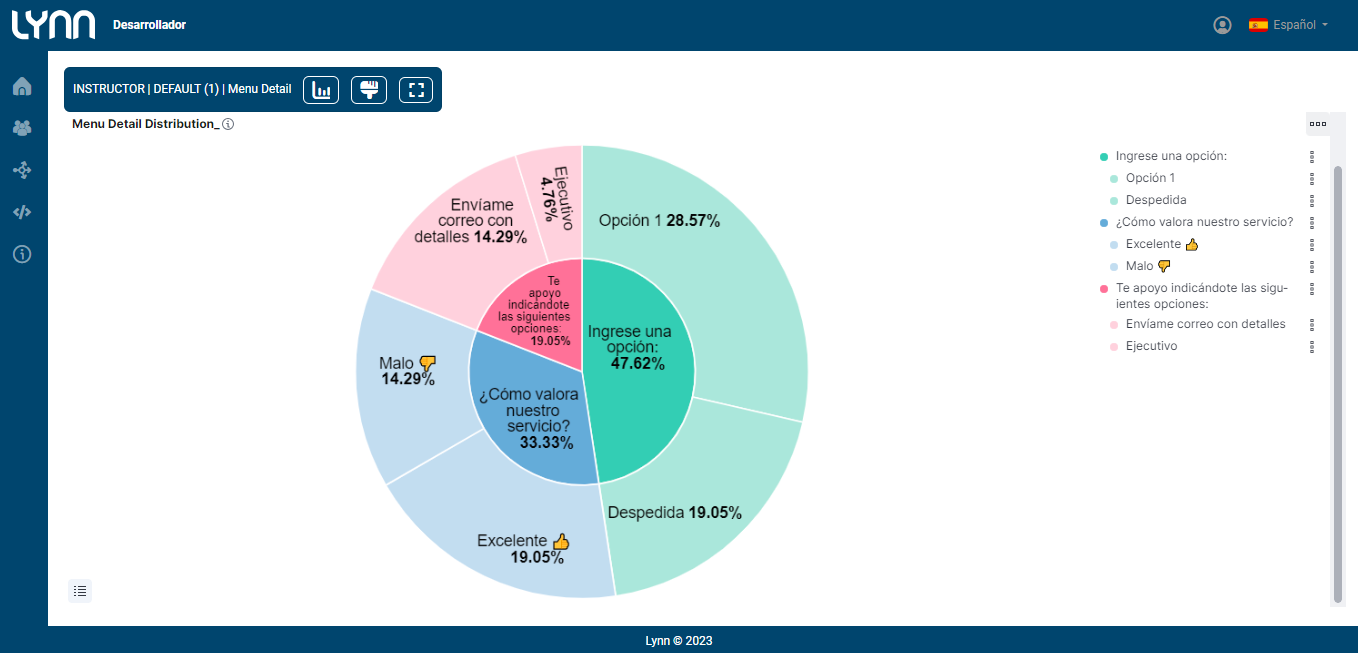
- Menu Detail Distribution: Pie chart distribution of menus that provides an indication of the most selected options and active menu present.
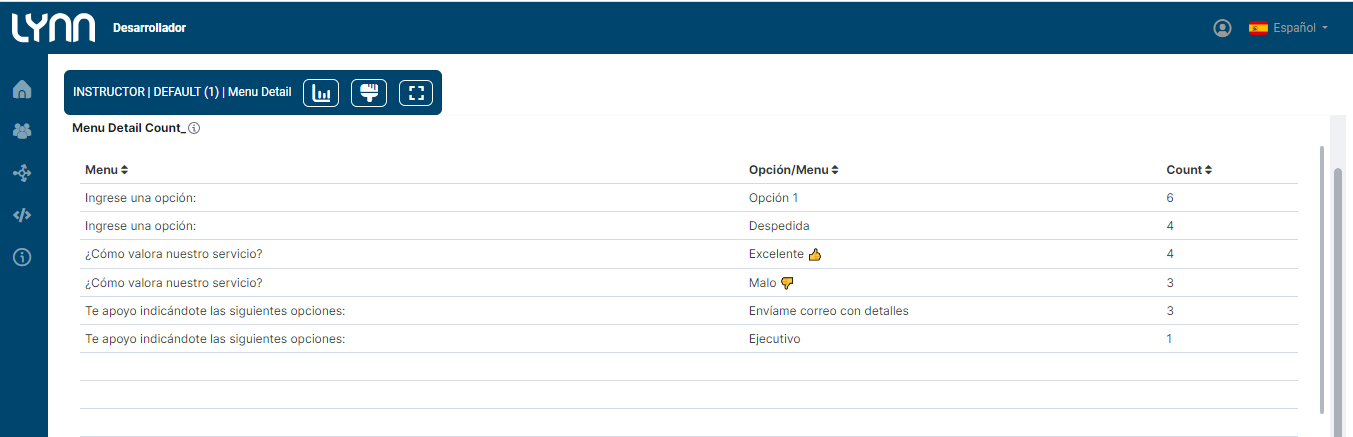
- Menu Detail Count: Hit count of menu options. Replaces the Menu Detail graph; this revision includes a unified count of the selected option, regardless of the written text.
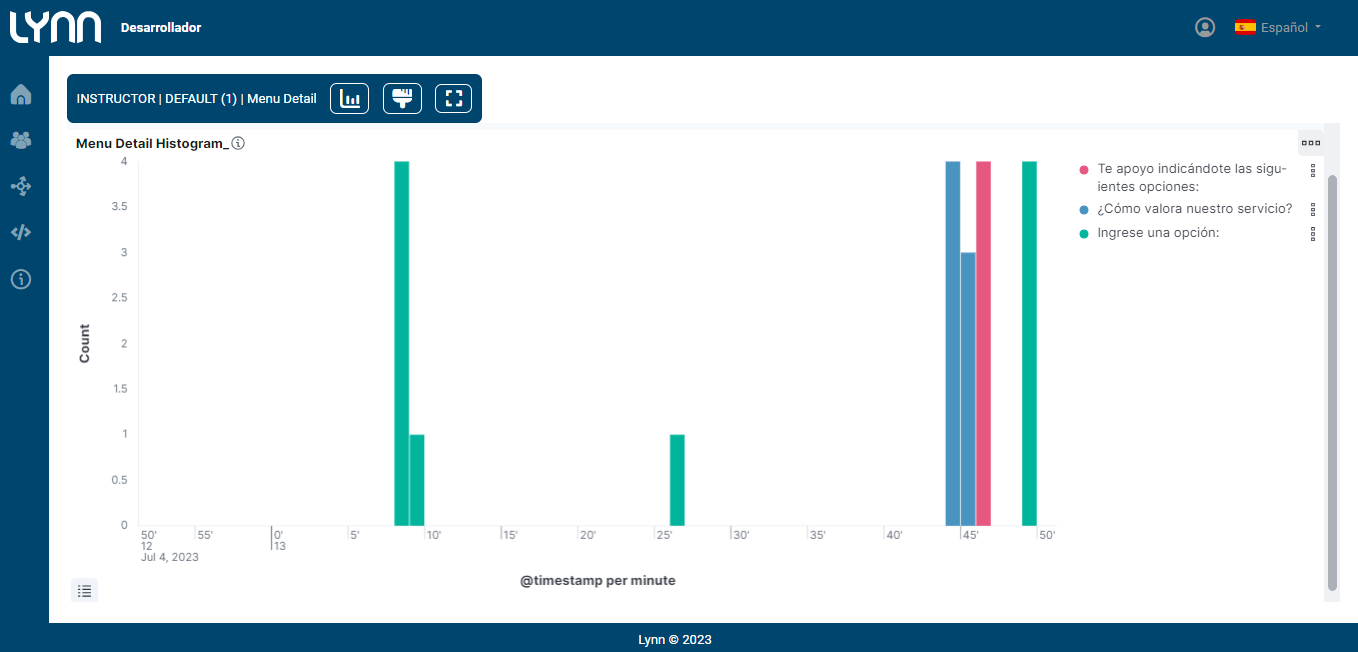
- Menu Detail Histogram: Historical list of selected menus that allows for export.
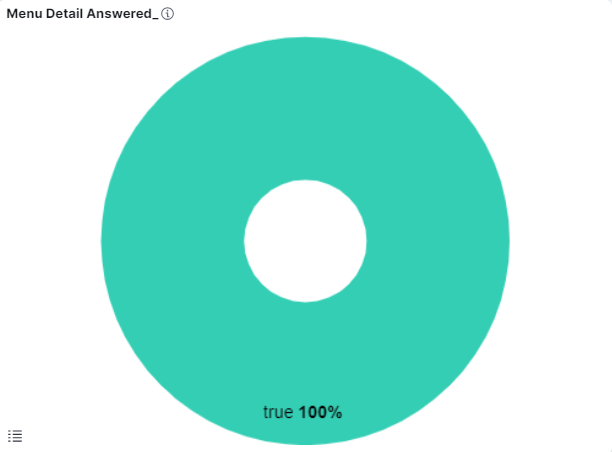
- Menu Detail Answered: Details of menus with accepted answers and unanswered responses that can be part of retries.
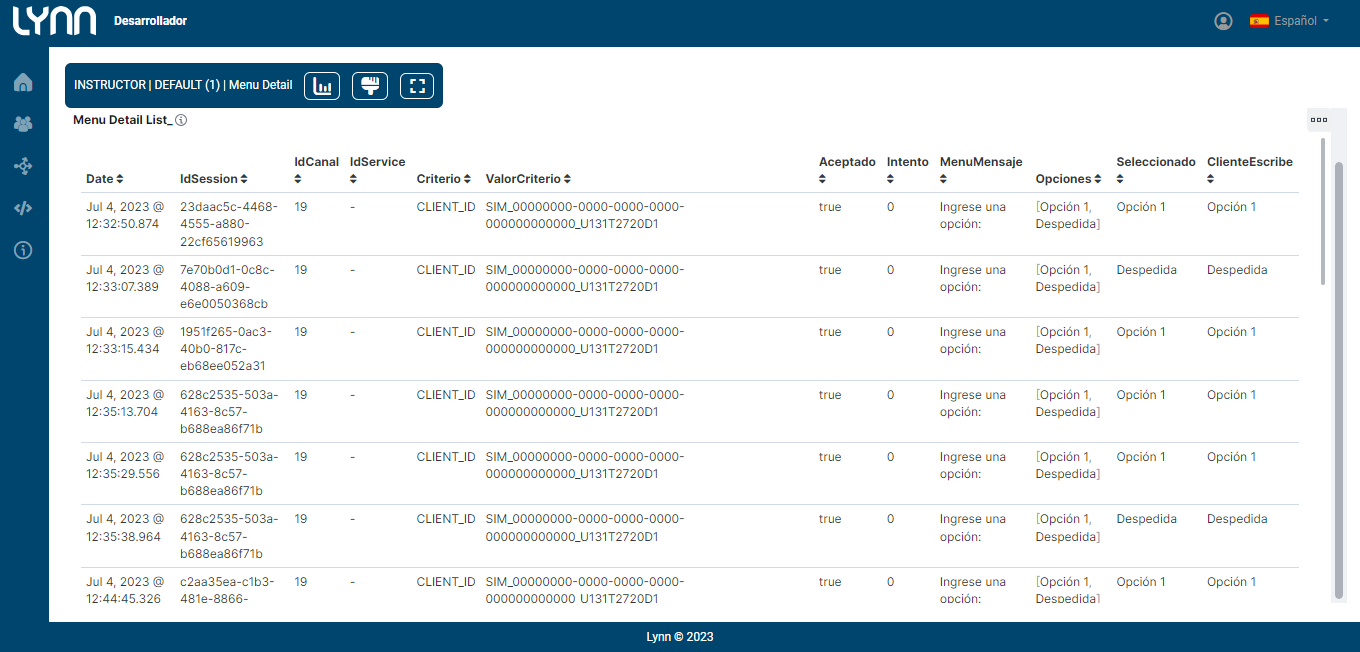
- Menu Detail List: Menu details in list format with all session traceability information and attempt markings, including selected response vs. written response.
Data Persistence and its Characteristics
The data stored in Lynn, for all operational purposes such as reporting or similar tasks, has persistence states defined based on data accessibility and the environments in which they are generated.
Unless special cases have requested an extension of the data persistence level, the storage characteristics are as follows:
For production environments
-
The maximum total persistence is up to 1 year.
-
Hot state data (immediately accessible): not less than 12 consecutive months from the current date.
For other environments or data sources
-
Total data persistence: 1 month.
-
Hot state data (immediately accessible): not less than 1 consecutive month from the current date.