


Knowledge Performance
This report provides an overview of the performance of cognitive contexts, organizing the information by date. Users can view a summarized performance of different cognitive models over a specific period, evaluating key indicators such as accuracy, response time, execution of trained intents, the most used cognitive engines in the tenant, and more.
All charts in the report include an interactive legend that allows dynamic data exploration. Clicking on a legend item hides the corresponding values in the chart, making it easier to analyze other categories and improve interpretation.
Cognitive Evaluations
This chart evaluates the cognitive model’s performance by relating evaluation times to the number of evaluations performed. It helps identify usage patterns, such as periods of high demand, and potential latency issues, assisting in prioritizing improvements to ensure a smooth user experience.
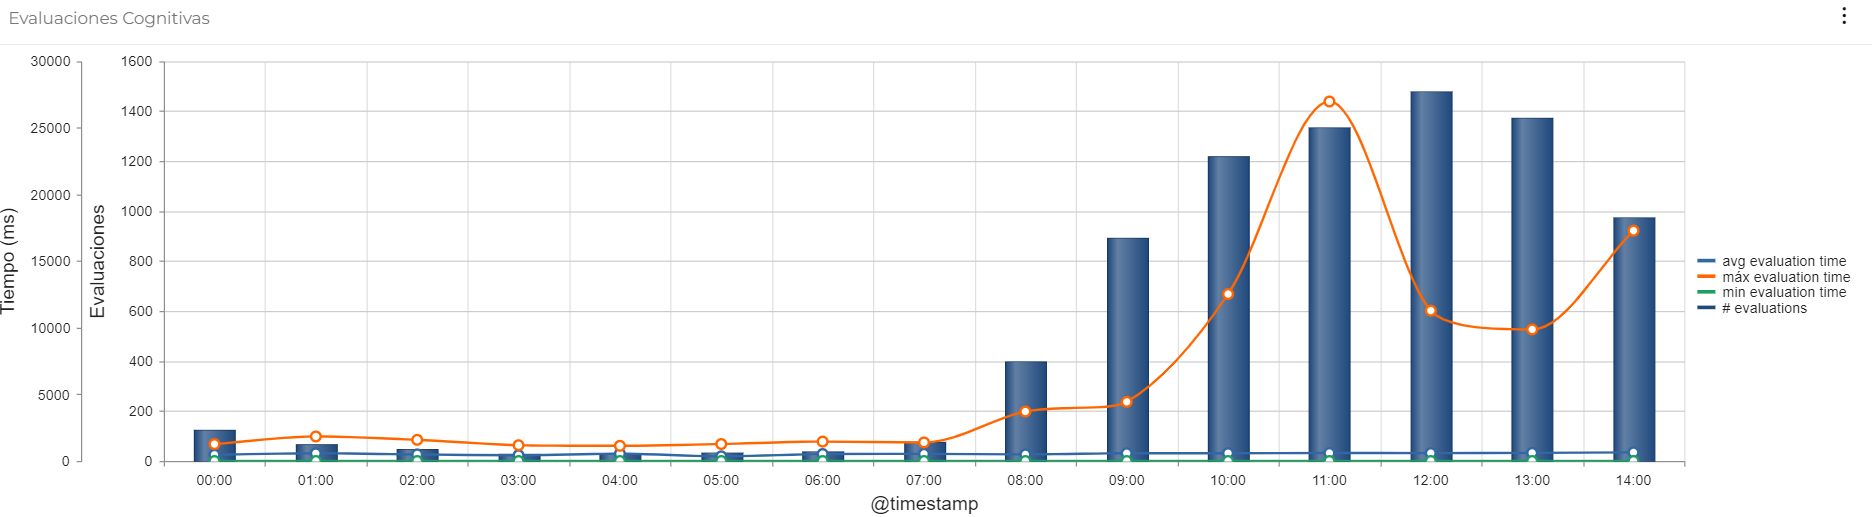
Data Interpretation
The chart combines bars and lines to illustrate the relationship between the number of evaluations and evaluation times:
- X-axis: Represents time, adjusted according to the selected date range in the dashboard filter.
- Primary Y-axis: Displays evaluation time in milliseconds (ms).
- Secondary Y-axis: Indicates the number of evaluations.
Relationship between bars and lines:
- Bars reflect the number of evaluations (secondary Y-axis), useful for observing system load at different times.
- Lines represent time metrics (primary Y-axis):
- Average time: Typical model performance.
- Maximum time: Latency peaks indicating possible issues or complex interactions.
- Minimum time: Fastest responses, associated with simple interactions or confident predictions.
Trend Identification:
- Overload: If both evaluation count and times increase, it may signal system overload.
- Anomalies: A large gap between maximum and average time suggests outliers requiring detailed analysis.
- Efficiency: Stable average time, even under high load, indicates a well-optimized model.
Use Case
Monitoring and Optimizing the Performance of a Cognitive Model
Description: In a customer service system using a cognitive engine to process and generate responses, the team responsible for performance and efficiency must evaluate response quality and evaluation time to ensure the model operates within desired parameters. This chart helps visualize the relationship between evaluation count and timing, supporting the identification of performance issues or bottlenecks.
How to use the chart:
- Monitor average evaluation time: Bars show average times to ensure responses are within acceptable limits. High averages may require model optimization.
- Identify evaluation time peaks: Spikes in line charts can indicate cognitive engine overload or issues with specific intents.
- Evaluate evaluation volume: The number of evaluations (secondary Y-axis) can help assess if high interaction volumes are negatively impacting performance.
- Drive improvement decisions: With this data, the team can decide to adjust model parameters, retrain it, or update infrastructure to improve performance.
Total Cognitive Evaluations
This chart visualizes the distribution and performance of intents handled by integrated cognitive engines. It helps identify usage patterns, workload imbalances, and opportunities to optimize configuration—improving operational efficiency and customer experience.
Data Interpretation
The pie chart shows the proportion of intents executed by each cognitive engine in the tenant, highlighting their share of total interactions. Each section represents an engine, and its size reflects the volume of managed intents, making it easy to identify which engine handles the highest workload.
- Interactive legend: Lists available engines such as LEA, IBM Watson, DialogFlow, and Microsoft CLU, along with the number of associated intents, visually linking each pie segment with its engine.
- Usage patterns and imbalances: A dominant engine may be managing key intents or be more efficient. Uneven distribution may indicate overuse or underuse, affecting performance.
- Optimization opportunities: Underutilized engines may be tuned or redistributed to balance the workload.
Use Case
Optimizing Load Distribution Across Cognitive Engines
Description: In a customer service system using multiple cognitive engines, the team must ensure balanced workload distribution. This chart helps identify usage trends and potential configuration improvements.
How to use the chart:
- Monitor usage: Identify engines handling more interactions. Heavy use may require adjustments.
- Redistribute load: If some engines are overloaded, redistribute intents to improve efficiency and reduce response time.
- Evaluate performance: Analyze volume and performance (e.g., response times, accuracy) to assess if model or training adjustments are needed.
- Optimize and expand: Underused engines can be optimized or trained to handle new intents, balancing workload.
- Strategic decisions: Use visual analysis to prioritize investment in high-performing or heavily used engines, or integrate new ones if needed.
Total Cognitive Intents
This table provides a detailed view of how interactions are distributed among cognitive intents and engines, supporting system performance evaluation and identification of improvement opportunities.
Data Interpretation
- Intent name: Identifies the cognitive intent and the type of interaction it handles, aiding workload analysis and its relevance in the interaction flow.
- Total interactions: Indicates how often each intent is executed. High-frequency intents are critical and must be monitored for performance.
- Cognitive engine: Indicates the engine executing each intent, enabling evaluation of each engine’s efficiency by its handled interaction count. A heavily used engine may be overloaded, while one with fewer interactions may need tuning or additional training.
Use Case
Customer Support System Optimization
Description: In companies using cognitive engines to automate responses, it's essential to optimize the most relevant intents and improve underperforming ones. The pie chart and associated table provide key insights for this goal.
How to use the chart and table:
- Identify most requested intents: The pie chart highlights frequently triggered intents, helping prioritize precision and effectiveness.
- Analyze performance by engine (table): Review the Cognitive engine column to check if the engine is efficiently managing its workload.
- Identify improvement areas: Review engine performance to detect overloads or underuse.
- Redistribute workload: If one engine handles too many interactions, redistribute load to balance the system and enhance performance.
- Strategic decisions: The data supports prioritizing improvements for high-impact intents and overall system optimization.
Interaction Detection Confidence
This chart evaluates the cognitive engine’s accuracy in identifying intents. It shows the model’s confidence level in assigning intents correctly, helping identify areas needing improvement through better training data and system tuning.
Data Interpretation
- X-axis: Groups detected intents based on input phrases and training data.
- Y-axis: Displays the cognitive engine’s confidence as a percentage (0 to 100). A value near 100 indicates high confidence, while low values reflect detection uncertainty.
This chart reveals not only the most frequent intents but also those with lower confidence, highlighting training gaps.
Interactive Legend
Two lines are displayed:
- Tenant average confidence: The average confidence level for all intents detected in a specific tenant.
- Intent average confidence: The average confidence per specific detected intent.
Point Interpretation:
- High points: High confidence (close to 100) shows the engine is certain it correctly identified the intent based on clear input patterns.
- Low points: Low confidence suggests doubt in the detection, likely due to ambiguous phrases or insufficient training.
Use Case
Improving Cognitive Model Accuracy in Customer Service
Description: In a customer service system, high confidence in intent detection is critical. This chart helps monitor accuracy, detect weak points, and make informed decisions for retraining the model.
How to use the chart:
- Assess confidence per intent: Confirm high-confidence intents are working well.
- Identify weak intents: Low points signal issues—review training data or input ambiguity.
- Compare frequency and confidence: High-frequency intents with low confidence may need prioritization.
- Decide on retraining: If many intents show low confidence, improve the model with more examples or clearer training data.
Cognitive Phrases Table
This table analyzes how the cognitive engine performs in identifying intents and generating responses. It provides key metrics like confidence, repeated calls, and result types, supporting training data refinement and interaction quality.
Data Interpretation
The table includes six columns:
- Text: User input.
- Intent name: Intent identified by the engine.
- Calls: Frequency of exact repeated input.
- Confidence: Confidence level in the identification (0 to 100).
- Minimum confidence: Lowest confidence recorded for that phrase.
- Result type: Output generated by the engine. Possible values include:
- NormalEvaluated: Input successfully processed with adequate confidence.
- SystemIrrelevant: Input not related to configured intents.
- SilentError: Error processed silently without user notification.
- NonCognitiveAbility: Input out of scope for the engine.
- Deflection: Redirected to another area or topic.
- DeflectionClientIdentification: Additional user info required before responding.
- Voice: Response generated for voice applications.
- CognitiveEvaluationError: Evaluation failed due to ambiguity or lack of data.
- NotFoundError: No intent or response assigned.
- LowConfidenceEvaluationError: Low-confidence detection with no reliable answer.
- Error: Generic processing error.
Low-confidence or problematic responses highlight areas for model or configuration improvements.
Use Case
Identifying Areas for Improvement in a Cognitive Engine
Description: A company uses a cognitive engine to automate customer service. Analysts want to improve accuracy and optimize responses. They use the table to identify training or model issues.
How to use the table:
- Text and Intent Name: Filter common phrases that return unexpected results (e.g., SystemIrrelevant, NotFoundError).
- Calls: Prioritize frequent phrases to maximize training impact.
- Confidence and Minimum Confidence: Review low-confidence phrases for model updates.
- Result type:
- Analyze entries like LowConfidenceEvaluationError or SilentError to refine intents or expand training datasets.
- Review DeflectionClientIdentification entries to ensure requests for user info are clear.